Tuesday, December 29, 2009

Workshop on Profitability and Cost Management

Indian industry, notwithstanding its growth projection, continues to face an uphill battle to identify the ‘real’ opportunities for growth amidst reduced consumer confidence and a customer population that is prone to churn and attrition. Many Indian enterprises, having invested heavily in good times are now finding it very difficult to sustain the cost structures with reduced margins. While the economic crisis will have serious impact on the growth and profitability of the companies, the crisis offers an excellent opportunity for companies to transform themselves towards long term profitable growth and increased stakeholder value. Not surprisingly several leading firms in India have started comprehensive transformation programs. The question though is – what should be the goal of such transformation programs? Should they focus on growth or profitability? Wouldn’t cutting costs offer immediate return of profits? Should more customers be acquired? Do more customer means more revenue and importantly more profits? While these are very common questions that the executives driving these transformation programs address, the reality behind these transformation programs is that often companies undertake these programs on “Gut feel” rather than basing them on “complete and consistent facts”.
To improve financial performance is a high priority in most organizations today. But to find accurate information on costs and profits for decision-making can be difficult. The problem is that traditional accounting systems were developed mainly for external reporting purposes. As a result, these systems often provide inaccurate and misleading information about costs and profitability. What you need is a system that will enable you to accurately measure costs and profitability for products, services, customers, and processes. It should also reveal the root causes of a certain cost or profitability level, enabling you to make the right decisions and take action to improve financial performance. What you need is Activity-Based Costing and Management. An unmatched concept that enables you to make better strategic and operational decisions to increase profitability, manage costs, and improve operational efficiency.
With ABC/M you can:
– Identify the most and least profitable products, services, customers, or sales Channels
– Accurately determine true costs for products and services
We are pleased to invite nominations from your organization for our One Day's Workshop on "Profitability & Cost Management". The details of the same are as under:

Date of The Workshop - Friday, 22nd January, 2010

Time - From 9:00 a.m. to 5.30 p.m.

Venue of the Workshop:
B.V. Rao Hall , 1st Floor
Deccan Gymkhana Recreation Building
Deccan Gymkhana Club
Opp Hotel Ait / Near Chitale Sweet Mart
Pune - 411 030

Faculty:
Mr. Rajendra Patil is B.E. - Polymer Engineering from Pune Univ. & a Cost Accountant (AICWA). He is a technocrat with 17 years of proven experience in Business Analysis, Providing Consultancy in Strategic Cost Management, Profitability Analytics, Organisational Performance Management and Business Process Management. He was working with SAS Institute R&D India Pvt. Ltd., Pune, a US based Enterprise, as a Specialist – Performance Management Solutions for Indian Customers. In 2008 he ventured into consulting and started APPS Consulting.The major objective of APPS is to provide consulting services to organizations in Banking, Insurance,Retail, Communication, Manufacturing, IT and KPO sector. The unique proposition of APPS is to prove and earn. Mr. Patil has undergone Training on Activity Based Costing & Profitability Management as well as on Expert Modeling and OLAP analysis at SAS, U.S.A. He has handled various projects related to (ABC/M) various Business Organisations from Manufacturing, Telecom, Retail and Banking Sector. His clients are Kirloskar Group, Suzlon Energy,Thermax,JK Files and Tools,Merck India,Syngenta India,Waterville TG, ING Vysya Life Insurance, SAS R&D India, Systems America Inc.,Mercedes Benz India,Finolex Cables.

Who Should Attend the Workshop:
• CEOs, Senior as well as Middle Level professionals from Finance, Marketing, Costing, Operations, Sourcing who are keen to take their functional expertise to the next level.
• Note: This is not just a workshop but this can lead to Consultancy on ABM Projects. Systimatic Implementation of ABM will add to your bottom line in Lacs!!
• Workshop Charges / Fees - (Includes Course Material, Break-fast, Tea-Coffee & Lunch & Certificate)
Rs.4800/- for 1 participant.
Rs 4500/- per participant for 2 participants from the same organization.
Rs.4200 /- per participant for 3 or more participants from the same organization.

Payment to be made by cheque in the name of "Human Capital Consultants".

With Best Regards,

Ajay Walimbe
Director
Human Capital Consultants
A/16, Pradnyangad Apartment
Opp. Haripriya Hall
Navsha Maruti Mandir Lane
Off Tanaji Malusare Marg
Pune - 411 030
Tel: 020-66203576
Mobile: +91-9881060190
We Turn People into Asset!

ajaywalimbe@vsnl.net

Monday, December 21, 2009

Customer Analytics with Profitability Solution


In the last post ‘Revenue is means and not end’, we saw that it is important to understand the customer profitability for taking business decisions around customer acquisition and retention strategy. I had made a point that once we know the profitability of various customers; we can understand who is creating profit and who is creating a loss. When we get this information we should not directly jump to the conclusion that we have to ‘chuck’ all those loss making customers. Initially we may concentrate on the other customers and define the strategy to acquire and make deliberate attempts to retain the profit making customers. We may not take any action on ‘loss making’ customers, if we wish to, as there could be various reasons to do so.
We have seen the ‘whale curve’ diagram, which tells us the information about potential to reach a profitability level that our organization has. The same information can utilized to understand the behavior of the customers and how to use the same to maximize the profits for our organization. I am going to talk about one of the techniques, which I call as a ‘2x 2 diagrams’. It has many other names also. This is nothing but a scatter diagram using two characteristics of customers. Imaginary thresholds are created to distribute the scatter diagram into four quadrants. I found it useful for the reason that once we start using these diagrams, we can understand the reasons for the behavior of the customers and hence, we can have our strategy to tackle those customers for our better performance. I have used possible actions in those diagrams and would like to mention that these could be some actions that you can take but are not limited to those only.

1) Customer deciles

Before going to the 2 x 2 diagram I am going to talk about another way in which the whale curve can be projected. Here we have created deciles of the customers based on their profitability. Once we have created such groups, we can understand who is falling in which group. This is a kind of segmentation based on the profitability. Once this segmentation is done then we can start analyzing the behavior of those customers that are making high profits as well as that are making high losses. The reasons could be buying profitable products, less cost to serve, good payment terms, less special requests, using better channels etc. Using these various reasons we can further segment the deciles in behavior patterns. This kind of detail analysis is useful to relate the behavior of a customer to the profitability that is brought in.

2) 2 x 2 - Customer Revenue and Profit

This is based on the information available on the revenue and profit that is brought in by the customers. We start with the top-right corner (HH). Here the customer buying is high and the profits are also high. This means the customers are not only bringing revenue they are possibly buying the most profitable products or less cost to serve. This type of customers should be retained at any cost. As well analyze their other demographic characteristics and try to acquire similar type of customers in future. The L-H quadrant is where the revenue is low but profits are high. Obviously we should sell more and more with cross sell, up sell efforts, so that we get maximum of the ‘wallet share’ from the customers. The H-L quadrant shows high revenue but not such a great profit. This could be possibly because of the product mix, cost to serve, payment terms etc. We can offer them alternate products that can serve customer’s requirements and are more profitable, we can offer ‘menu based pricing’ for few of the services. We may also remove some the services that are not adding value to the customer. The lat quadrant L-L, is low revenue and low profitability. We should try to move them horizontally to increase the revenue or vertically to increase profits.

3) 2 x 2 – Cost to serve and revenue

From the earlier analysis if we find that the basic reason for difference in profitability is the behavior of the customer and particularly the ‘cost to serve (CTS)’, then we can analyze this behavior and can understand the reasons, which could be the buying patterns, special requests, channels used, changes in schedules, changes in requirements after ordering, knowledge about the product etc. Let us look at the quadrants. The L-L quadrant is where the CTS is low but the revenue is also low. We should try to sell more by cross sell, up sell strategy and keeping the services levels same. The H-L quadrant shows high CTS and low revenue. So the customer is too demanding. Here we can discuss the real requirements of the services that are needed by the customer. First of all remove all the services that are not needed by the customer. We can make our customer understand the more number of orders, frequent changes in the orders and products, special packing needs are adding costs and could be reconsidered. Then from the required one decide which can be offered by default and the other can be pushed to ‘pay per use’. The L-H quadrant is the best quadrant here and we should try to sell more and more to the customers in this quadrant with the similar level of service.

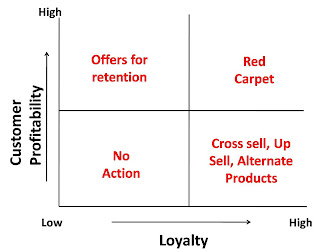
4) 2 x 2 – Loyalty and Profitability

The 2 x 2 diagram of loyalty and customer profitability can be used to allocate and program the marketing campaigns. Here the H-H quadrant shows that the customers are with you for a sufficient amount of time and they are profitable too. You can use these customers as your brand ambassadors. Understand their requirements and keep them happy. The H-L quadrant is happy with your service o products, but they may not be buying with a full potential from you. So you may spend more on cross selling or up selling to them. They may not be buying the most profitable products from you, so you can try to sell alternate products to them. The L-H quadrant is there the customers are profitable but they are not with you for a long time. This could be the customers are new or they like your products but may not like the service. Understand the requirement of those customers and improve the service or try to retain the new customers that are adding to your portfolio. The L-L quadrant may not be looked into initially, unless there is large number of customers lying there or a major portion of revenue is coming from those customers. If this is true then it really a cause of concern for the organization and should be given priority.

In some industries like telecom, the value of ‘probability to churn’ is used instead of loyalty. This is the probability that the customer is likely to terminate using your services. There we can use the similar graph with an attribute ‘churn’ instead of loyalty.


Till now we have seen various attributes for analysis which are objective and historic. But we can also use the attributes which are analytical and predictive. Probability to churn is one of such attributes. We can use similar attribute that is related to profitability and is called as ‘Future profitability’. The profitability we were talking of was the ‘current profitability’. Not all the decisions can be taken based on the current profitability or the historic profitability of the customer. We also have to see the future profitability potential in the customer. The future profitability is actually made up of two parts viz. a) predictive profitability b) potential profitability. Predictive profitability is if you extrapolate the profitability because of the products or the services that the customers are using in future. Potential profitability is the profitability that is brought in because of the customers propensity to buy other products and if they do buy, the profitability band they would fall in.


5) 2 x 2 – Current and future profitability


Here we are putting the current profit v/s the future profit (combination of predictive and potential profit). Profitability solutions provide the information about the current profitability for the customers. If the organization has calculated such ‘current’ profitability for a long period they would have history about the profit. Using this information and other variables statistical models can be created to calculate the future potential of profit. This is important to understand as the customers that are unprofitable today may have potential to be profitable in future and vice-a-versa. The text book example for this is the young doctor who has started his practice recently may not look profitable today but she can have potential to bring profits in future. Also a doctor who is potentially retiring in few years may look profitable today and had provided good results in past may not be a good future potential.

If we look at the L-L quadrant where the current and future profit looks low, you may not want act on them immediately (unless this is a large portion of customers). The L-H quadrant where the current profit is low but there is good potential in future. Here you would like sell more to them by understanding there requirements. For example for the young doctor in the earlier example it may start with the credit products for the clinic and may have potential to buy house and bigger or luxurious cars etc. H-L quadrant is where the current profit is high but does not look great in future. You can maintain the current relationship with them and the marketing spend may not allocated much to them. The best is the H-H quadrant where the current and the future profit look good. The strategy could be to retain these customers at any cost and acquire customers with similar profile.

6) 2 x 2 – Predictive and potential profitability

We can also go deeper in future profitability and see the analysis of predictive profitability against the potential profitability. If we look at L-L quadrant then we can see that if both predictive and potential profitability is going to be low then the overall future profitability is going to be low and we may not wish take immediate action (as always if this is not true for the major section of customer). In the L-H section we can see that the customer would be profitable in future with the same type of products but the behavior shows that the propensity to but other product is good. This may bring future profits for the organization and you may choose them for cross selling other products. H-L section is opposite to this and shows that these customers are unlike to buy other products but they can be profitable with the current products they are having. So the organization may look at up selling. For the H-H section where they would be profitable with current products have great potential for buying new products and could be profitable with those new also. The best segment of customers to have and you can try and spend more on selling them.

We have looked at various types of analysis that we can perform using the profitability information. These attributes could be objective as revenue, loyalty etc. or could be predictive (and hence subjective) like propensity to churn, future profitability. The future historic, current and future profitability information can be used to calculate Customer Lifecycle Value (CLV) and it can also be used for analysis. For this you need correct calculation of Customer profitability and the best way to get is using Activity Based Management Concept.

Finally wish you happy holidays. Hope you have done well in 2009 and best wishes for 2010.